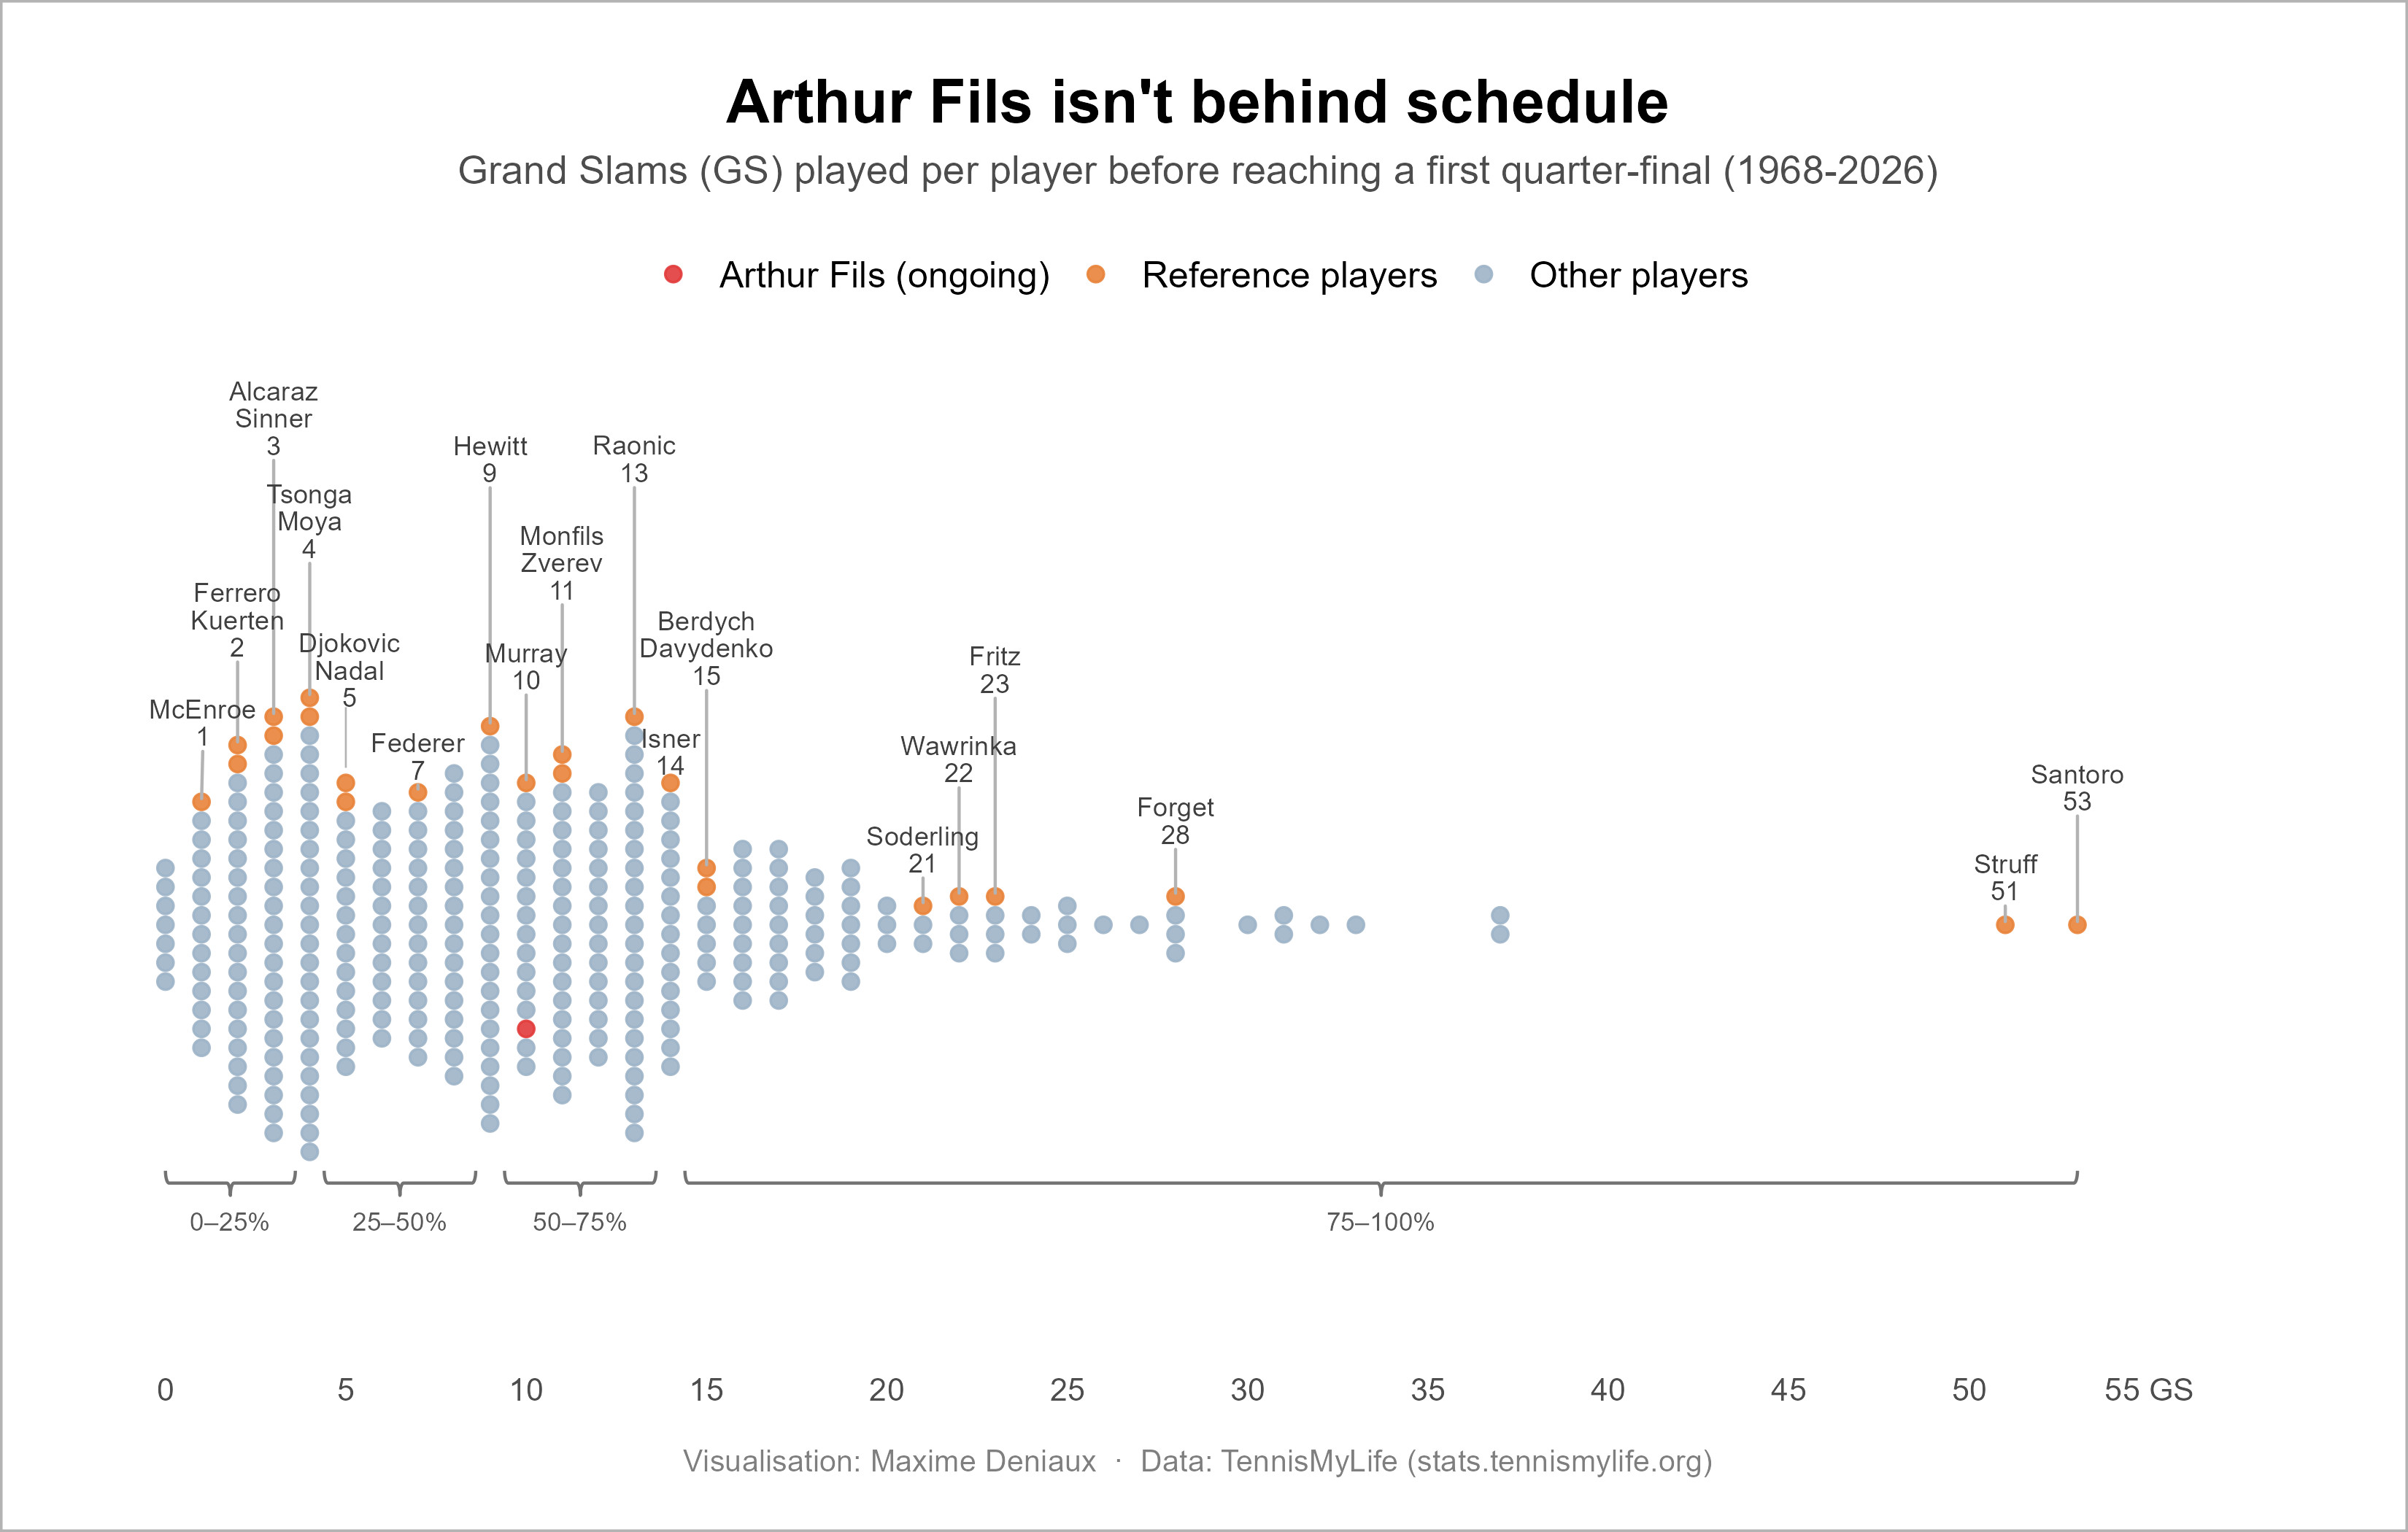
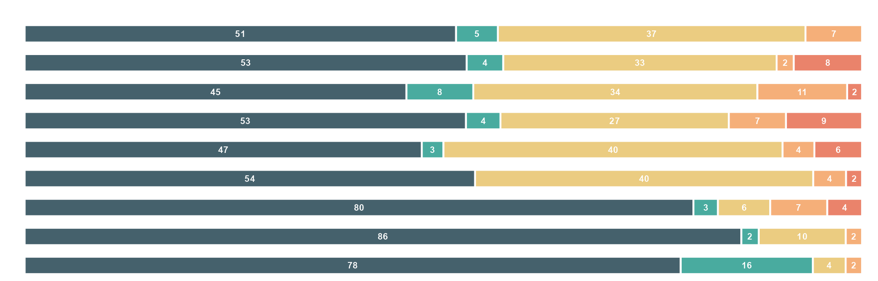
How many Grand Slams does it usually take to reach a first quarter-final, and where does Fils stand?
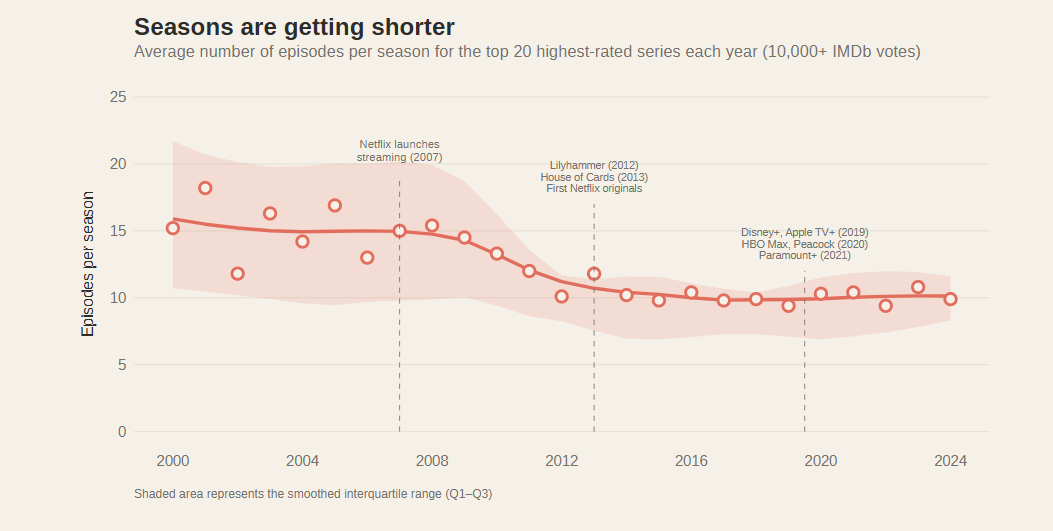
IMDb data on the top-rated series since 2000: did seasons really shrink, and when did the shift happen?
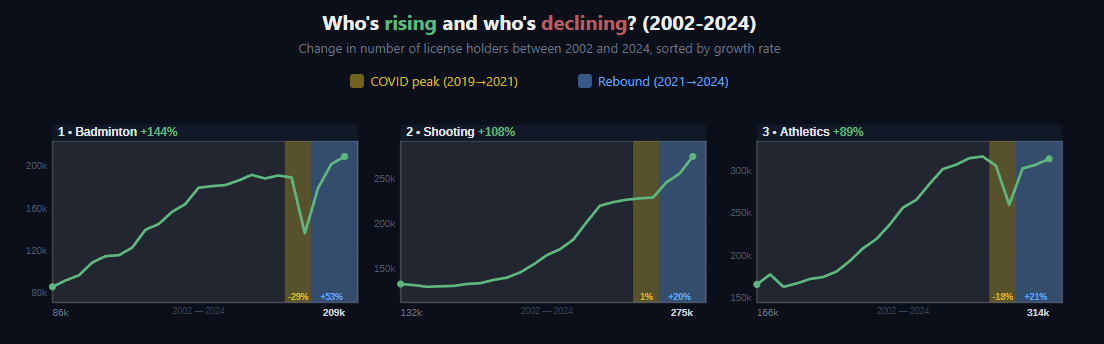
22 years of license data (2002–2024) across France’s 19 largest single-sport federations: who’s growing, who’s fading.
Two R web scraping scripts that collect and filter French public-sector job offers automatically.
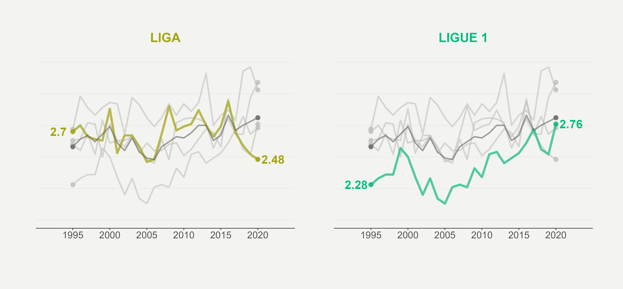
Goals per match and most frequent scores in the 5 major leagues, 1995–2020, as pizza charts.
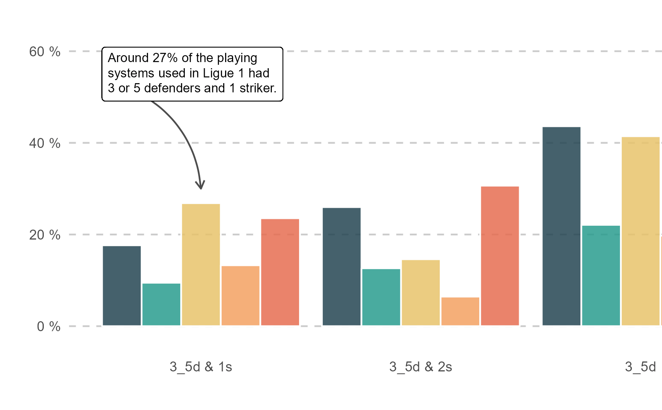
Which playing systems teams used in the 5 major leagues in 2023, grouped by number of defenders and strikers.
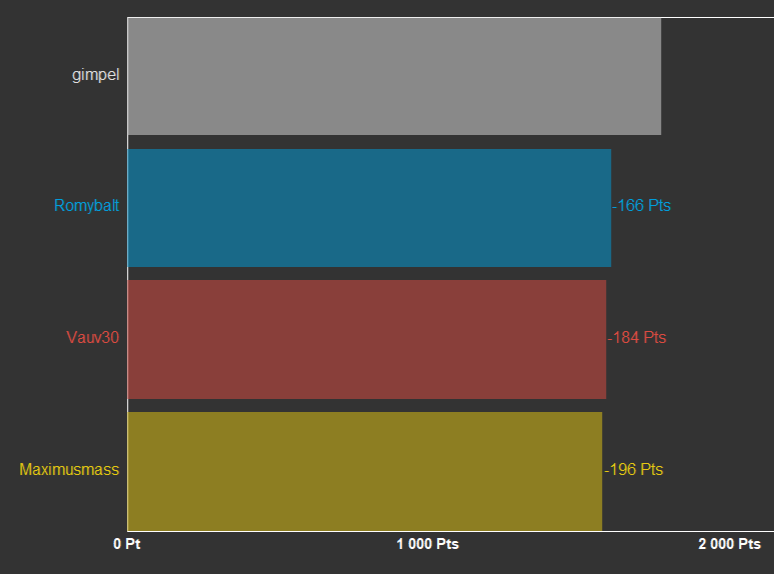
A season of TennisDrawChallenge, a free tennis prediction game, replayed as an animated points race.
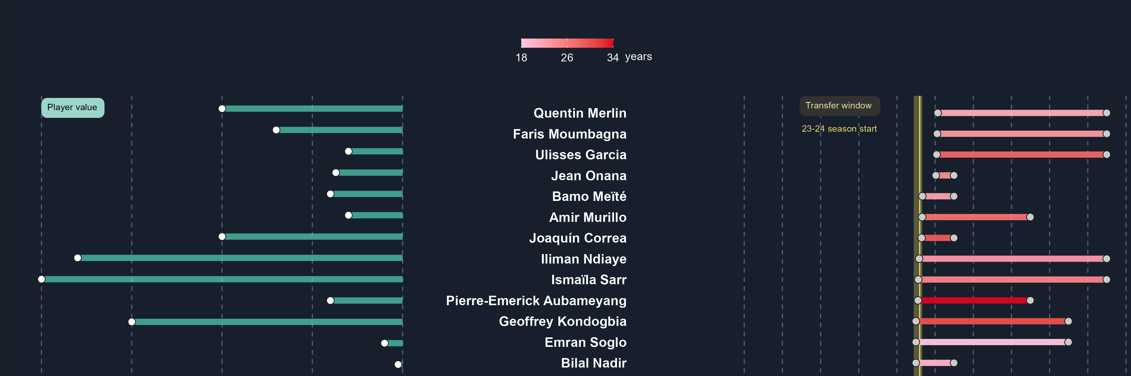
Contracts, ages and market values of the Marseille squad, after years of heavy transfer activity.
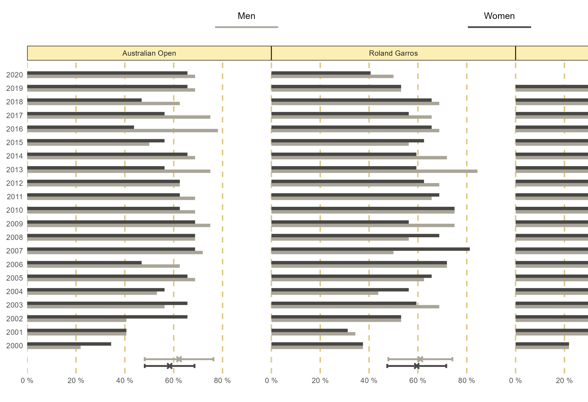
How many top seeds reach the 3rd round of each Grand Slam, men and women, from 2000 to 2020?
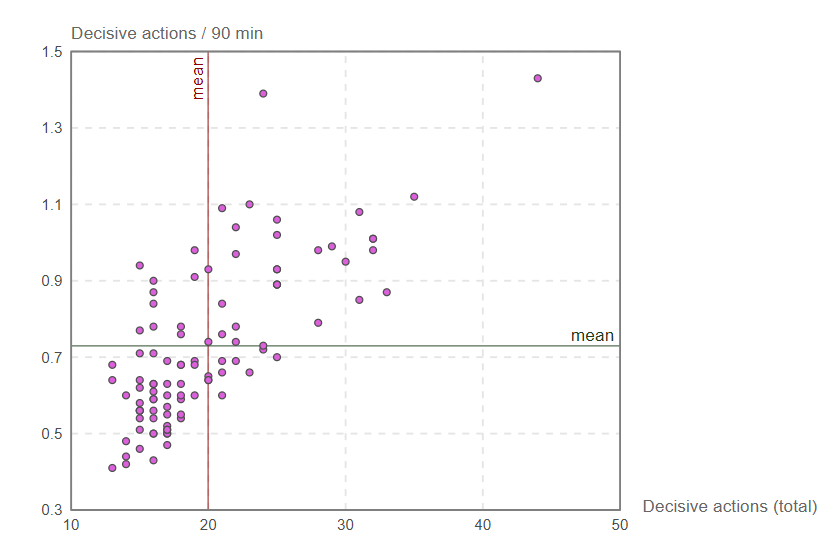
Per-90 stats vs. how often a player is actually decisive: an interactive look at the 5 major leagues in 2022-23.
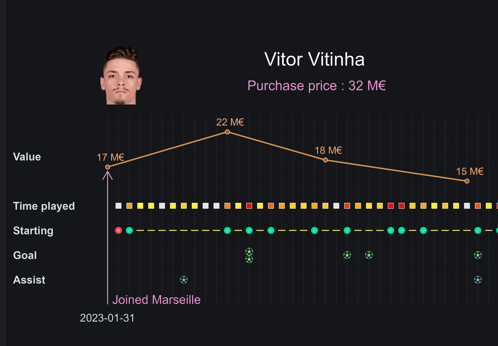
Starting from Vitinha’s lack of playing time, a comparison of the sporting vision of several Ligue 1 clubs.
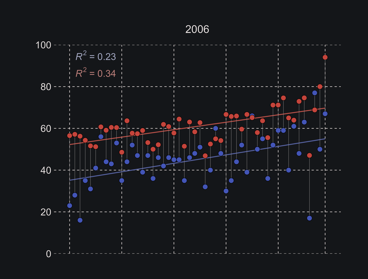
Does playing more matches in a season help players climb the ATP top 50 ranking?
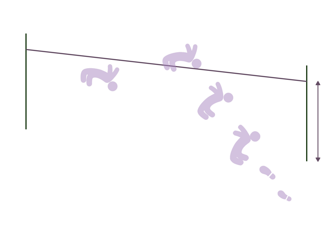
High jump world records: do today’s athletes get close to marks set in the last century?
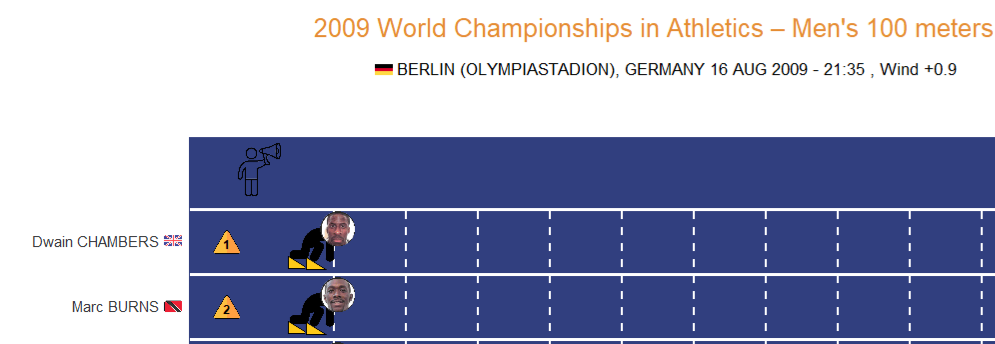
Usain Bolt’s world record in the 2009 Berlin 100m final, replayed as an animated chart.
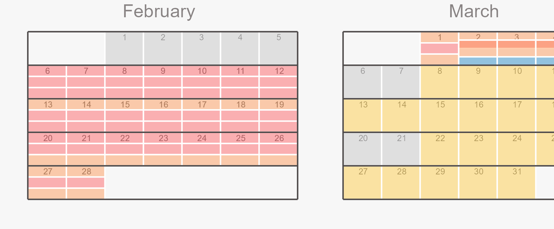
The 2023 ATP calendar in one graphic, at a time when players complain about the schedule.
Match durations on the ATP tour since 1998, and whether Murray really plays more marathons than the rest.
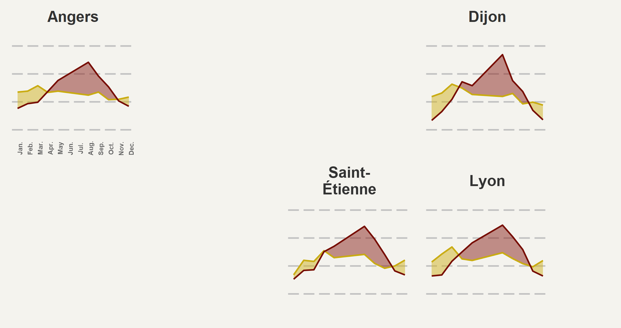
Average temperature and wind speed during Ligue 1 matches, by city and month.
Neymar’s career through his injuries, from Santos to Barcelona and PSG.
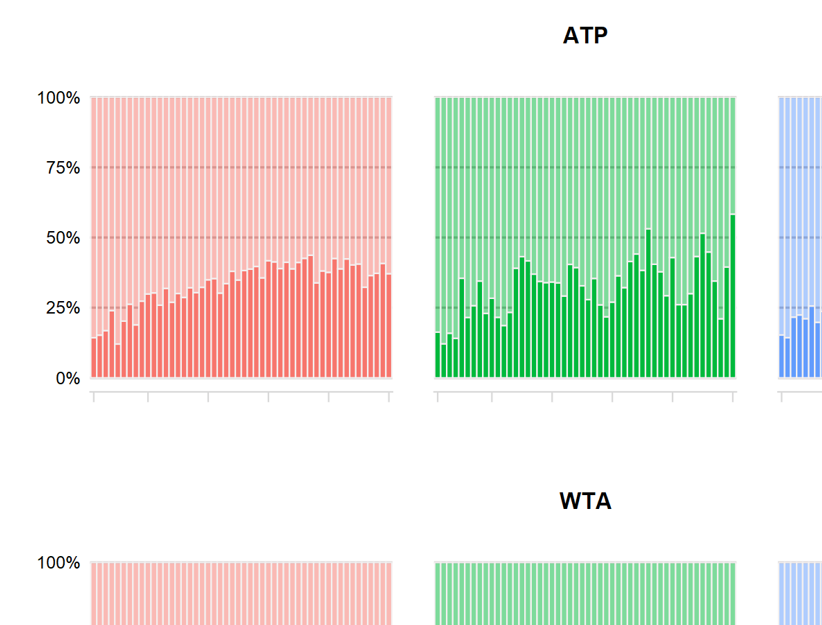
ATP vs WTA, 2010–2022: how often do top-50 players lose to someone ranked below them, by surface?
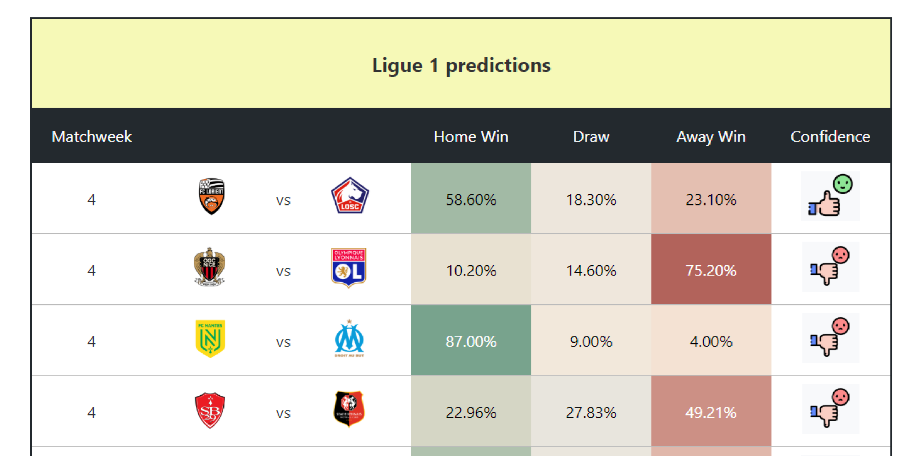
A gt tutorial in R: color gradients and team logos in a Ligue 1 predictions table.
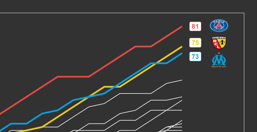
Marseille vs Lens: the race for Ligue 1’s direct Champions League spot, in charts.
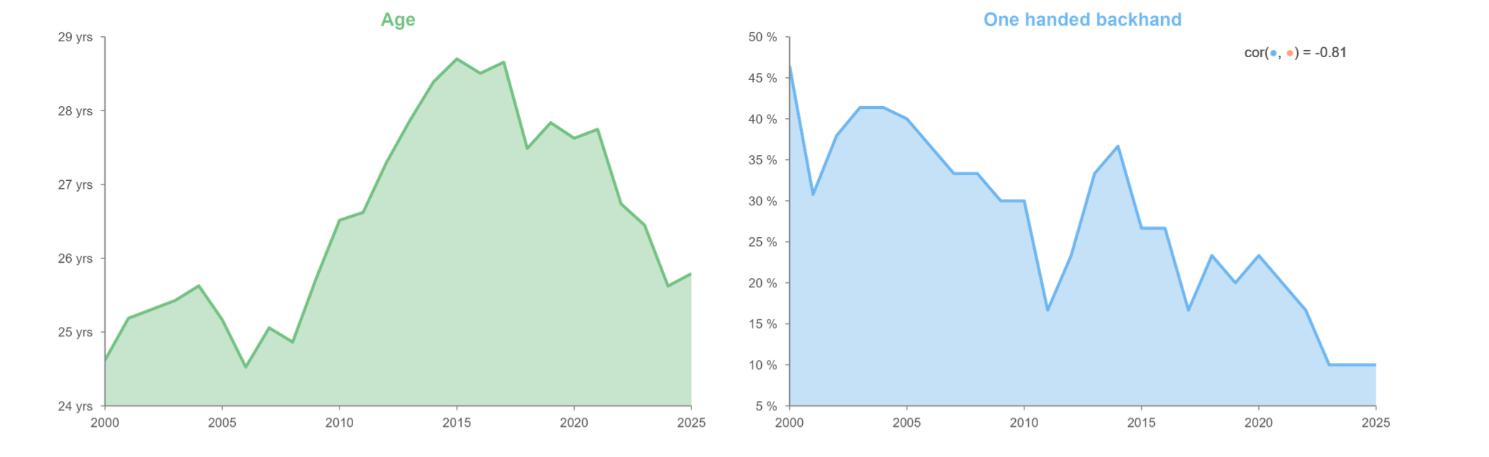
Age, height, one-handed backhands and aces: how the ATP top 30 has changed since 2000.
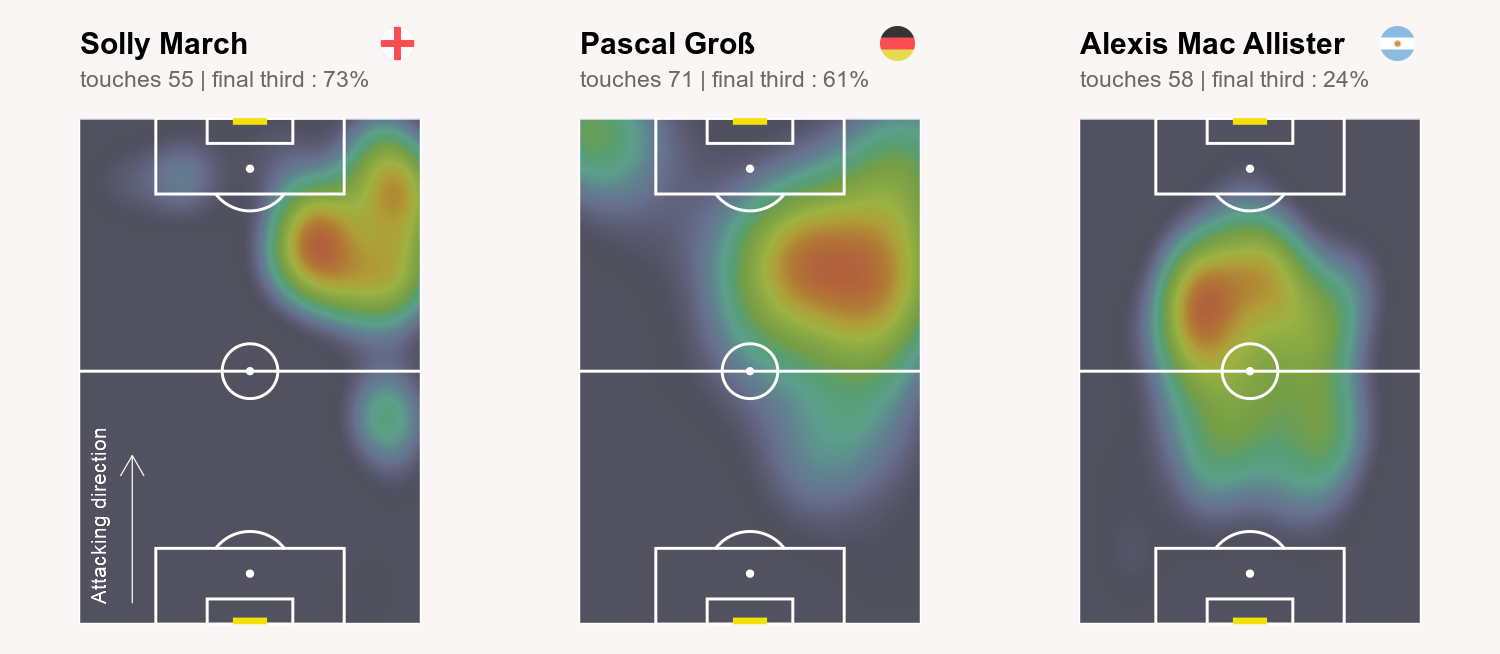
Follow-up tutorial: several player touchmaps on a single graphic, with country flags.
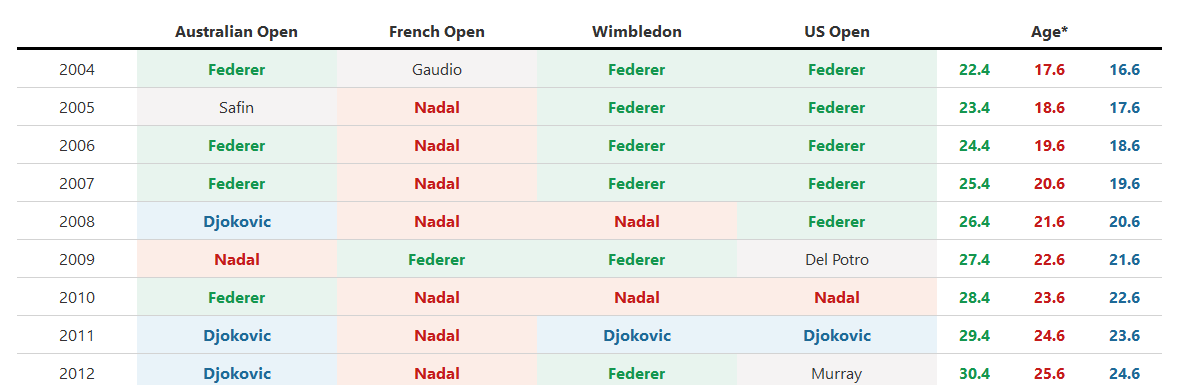
A step-by-step R tutorial: rebuilding a table of Grand Slam winners since 2004, with the Big 3’s ages added.
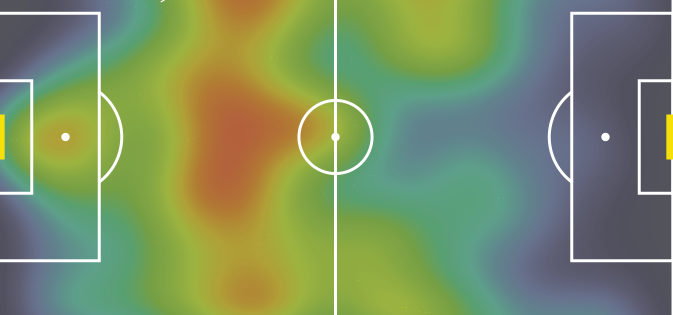
A step-by-step R tutorial: from raw match event data to a map of a player’s ball touches on the pitch.
Drop your email to get notified each time I publish a new dataviz. No spam, unsubscribe anytime.
By subscribing you agree to receive an email for each new publication. See the legal notice.